Vapor-Compression Cycle Analysis of a Residential Air Conditioner
Lab experiment and report: took the measurements with my lab group, then did the cycle analysis and wrote the report
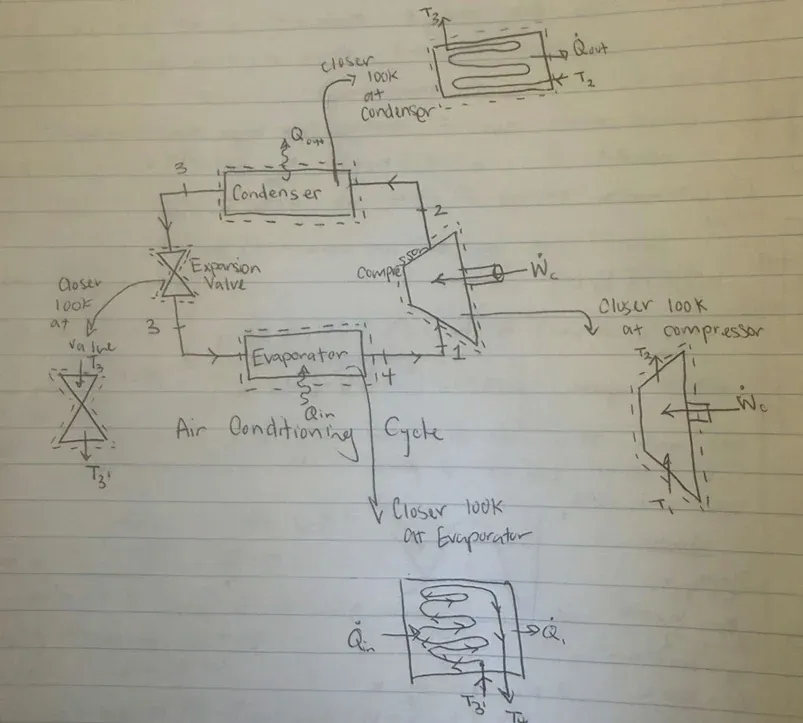
Measured a Carrier R22 air-conditioning system at six state points and worked out the heat flows, compressor work, and coefficient of performance from the data, then examined why the measured COP came out higher than the ideal range.
Objective
Analyze a residential Carrier air-conditioning system as a vapor-compression refrigeration cycle: measure the refrigerant’s temperature and pressure at each stage, find its state and enthalpy from property tables, and calculate the heat flows, compressor work, and coefficient of performance.
Method
The lab rig is a working R22 system fitted with thermocouples and pressure sensors at the evaporator, condenser, and compressor inlets and outlets. With the system running, we recorded conditions at six state points along with the refrigerant flow rate. I then used NIST refrigerant tables to find enthalpies at each point and applied the first law to each component.
Results
The evaporator absorbed 3.70 kW, the condenser rejected 4.37 kW, and the compressor drew 0.67 kW, giving a measured COP of 5.52. That is above the 2-to-4 range expected for an ideal analysis of this setup, so a good part of the report is about why: instrument uncertainty in the thermocouples and gauges, heat exchange with the room, sensor placement, and the fact that the rig has no separated indoor and outdoor sections. The exercise was less about getting a textbook number and more about tracing where a real measurement diverges from the model.